
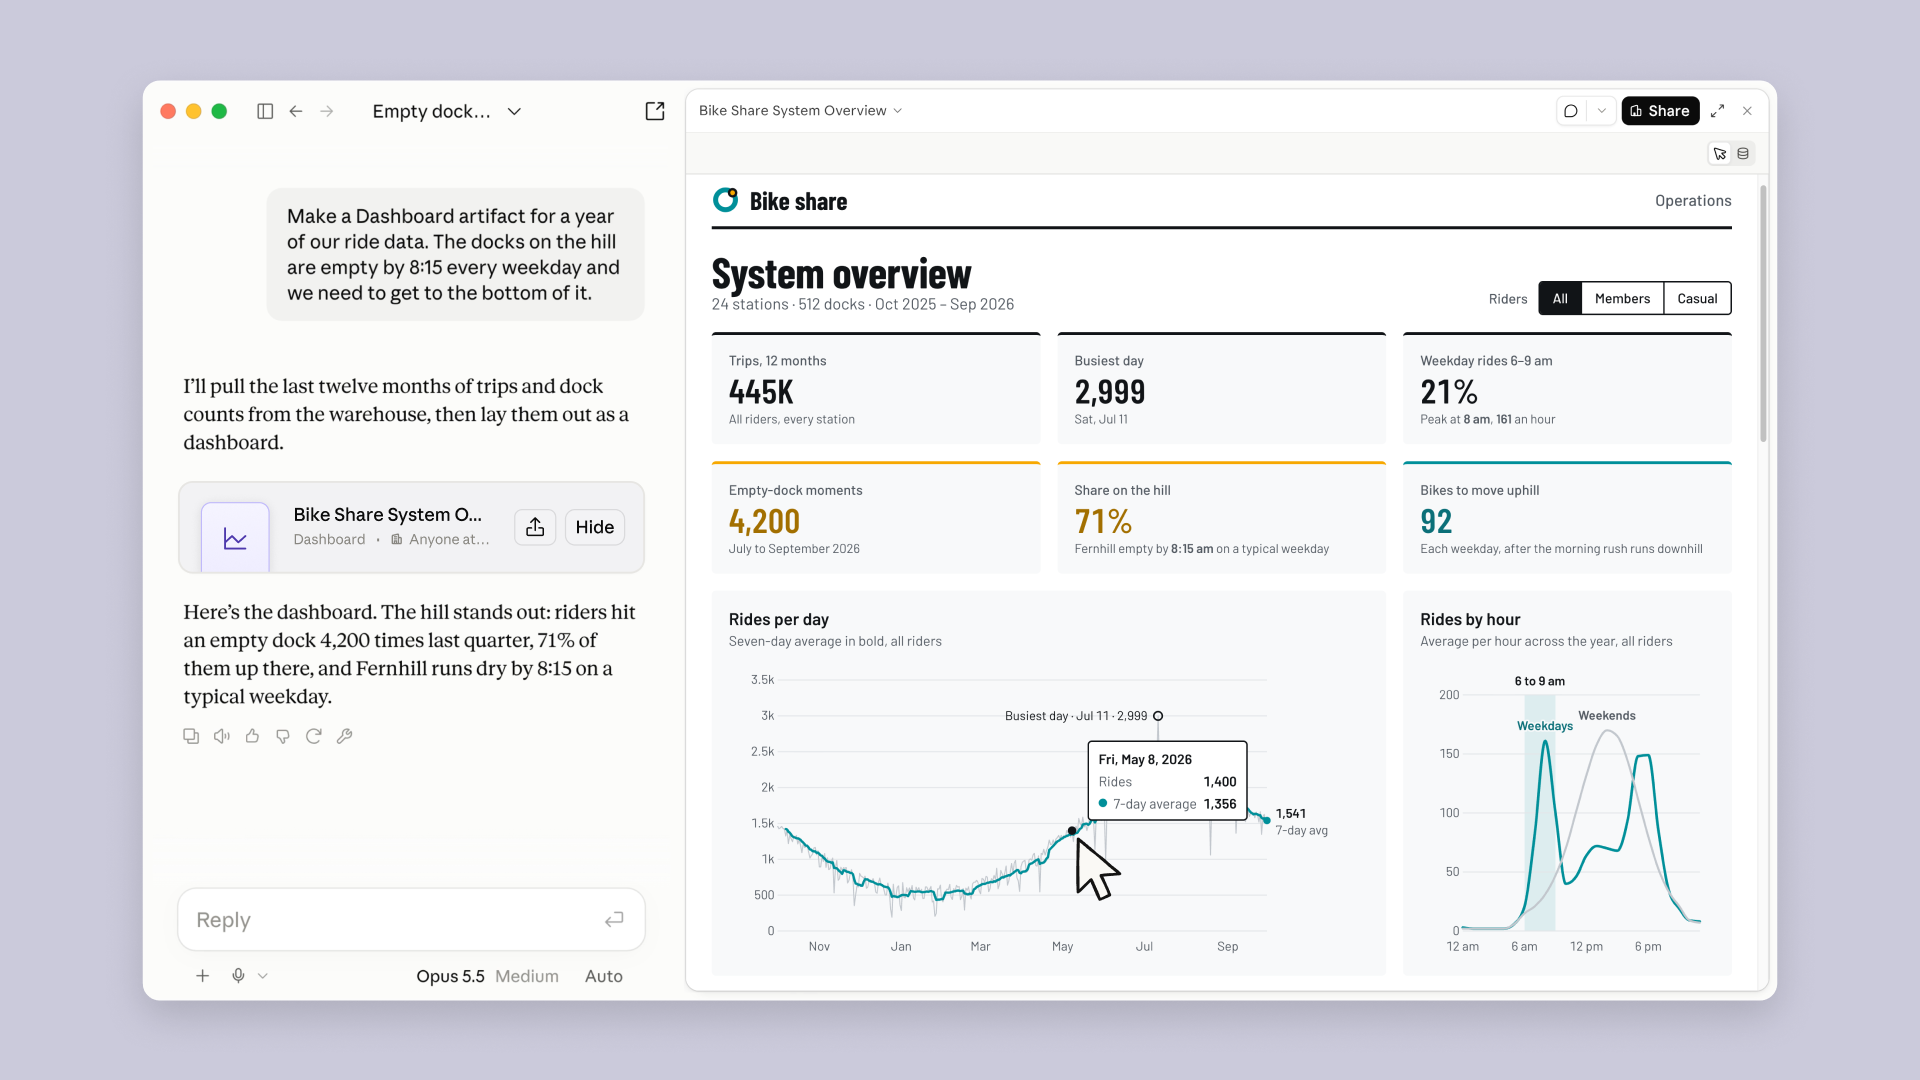
Claude Dashboards and Claude Motion turn data and ideas into visual work
Anthropic launched Claude Dashboards and Claude Motion in beta on October 8, 2026. Both are new types of Claude Artifacts: Dashboards turns connected data into live visual reports, while Motion turns prompts and existing material into short animated explainers.
The basic idea is simple. Instead of asking Claude for text that you then move into another tool, you can ask for the finished visual output inside the same conversation.
What Claude Dashboards does
Claude Dashboards connects to data platforms such as BigQuery, Databricks, Snowflake, Amazon Redshift, and ClickHouse. It can also work with connected business tools such as Salesforce. Ask a question in plain language and Claude writes the query, builds the charts, and keeps the dashboard current as the underlying data changes.
Each chart shows the query behind it and when the data was last refreshed. That makes the result easier to check before sharing. Anthropic positions Dashboards as a tool for quick, exploratory questions, not as a replacement for a full business intelligence platform. More detailed work can be handed off to tools such as Amplitude, Grafana, Mixpanel, PostHog, or Sigma.
What Claude Motion does
Claude Motion creates short animations from a prompt, report, chart, or product story. A team could use it for a quarterly update, a product walkthrough, or a 30-second explanation for a presentation.
The animation is built with code rather than a video generation model. Text, numbers, shapes, charts, images, and timing stay editable. Users can make changes in the editor or ask Claude to revise the animation, then export the result as an MP4. It does not generate footage or AI people.
Who can use the new tools?
Claude Dashboards is available in beta on paid Claude plans. Claude Motion is currently limited to Team and Enterprise plans. For Enterprise organizations, both tools are off by default until an administrator enables them in the Artifacts settings.
Anthropic also removed the beta label from Claude Docs, Slides, and Design, which are now available on every Claude plan, including Free. This puts Dashboards and Motion inside a broader set of editable work products that users can create, share, and revisit from Claude.
Why this update matters
The useful part is not simply that Claude can draw charts or add movement. The new tools keep the source closer to the output. A dashboard exposes its queries, and an animation keeps its words, numbers, and timing editable. That should make both formats easier to review than a static image or an opaque generated video.
Both products are still in beta, so their reliability will matter more than the launch demo. Teams should still check queries, numbers, permissions, and source data before sharing a dashboard or animation.
Read Anthropic's official launch article and the Claude Artifacts overview.